Pardon me but this post is deeply hilarious to me. If the country is being hit with nuclear attack, then what happened to the silo is the least of the concern. Most of the missiles are going prioritize the cities first anyway. If the cities are already gone, what happens to the silo contamination cease to matter.Part 2.
HOW FALLOUT AND FATALITIES SHIFT WITH THE WINDS
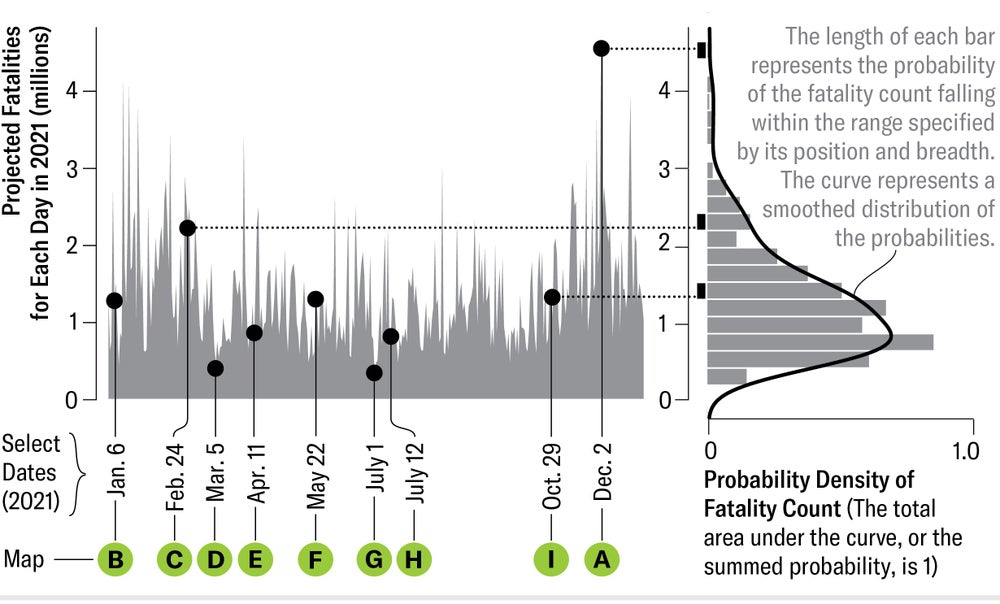
A concerted nuclear attack on the missile silos in the U.S. heartland would generate radioactive dust that travels with prevailing winds. Sébastien Philippe and his colleagues at Princeton University’s Program on Science and Global Security used archived weather data to simulate the paths of the resulting plumes for 48 hours, by when most of the dust settles. Because wind directions change daily, the researchers computed fallout dispersal from an 800-kiloton warhead detonating simultaneously at each of 450 silos on any given day of 2021. The selections below (A–I) demonstrate the variability of wind directions and, consequently, of the doses of outdoor radiation received over four days of exposure to radioactivity. The scientists further combined these simulations with data on population density and building height to calculate the resulting fatalities. Someone absorbing four grays (equivalent to four joules of radiation energy per kilogram of body weight) would have a 50 percent chance of dying, but people sheltering in bigger buildings would receive smaller doses. Depending on wind directions, a nuclear attack on the missile silos could kill several million people.

Credit: Sébastien Philippe, Svitlana Lavrenchuk and Ivan Stepanov
Fatality Count: For a simulated attack on any day of 2021, the scientists computed the resulting fatalities. The chart shows the impact of variable wind directions on the estimated fatalities after four days of exposure. The estimates range from 340,000 (for an attack on July 1) to 4.6 million (on December 2). The average estimated death toll is 1.4 million. The curve shows the probability (technically, probability density) of the number of fatalities specified on the vertical axis.

Credit: Sébastien Philippe, Svitlana Lavrenchuk and Ivan Stepanov
WHICH LOCATIONS ARE THE RISKIEST?
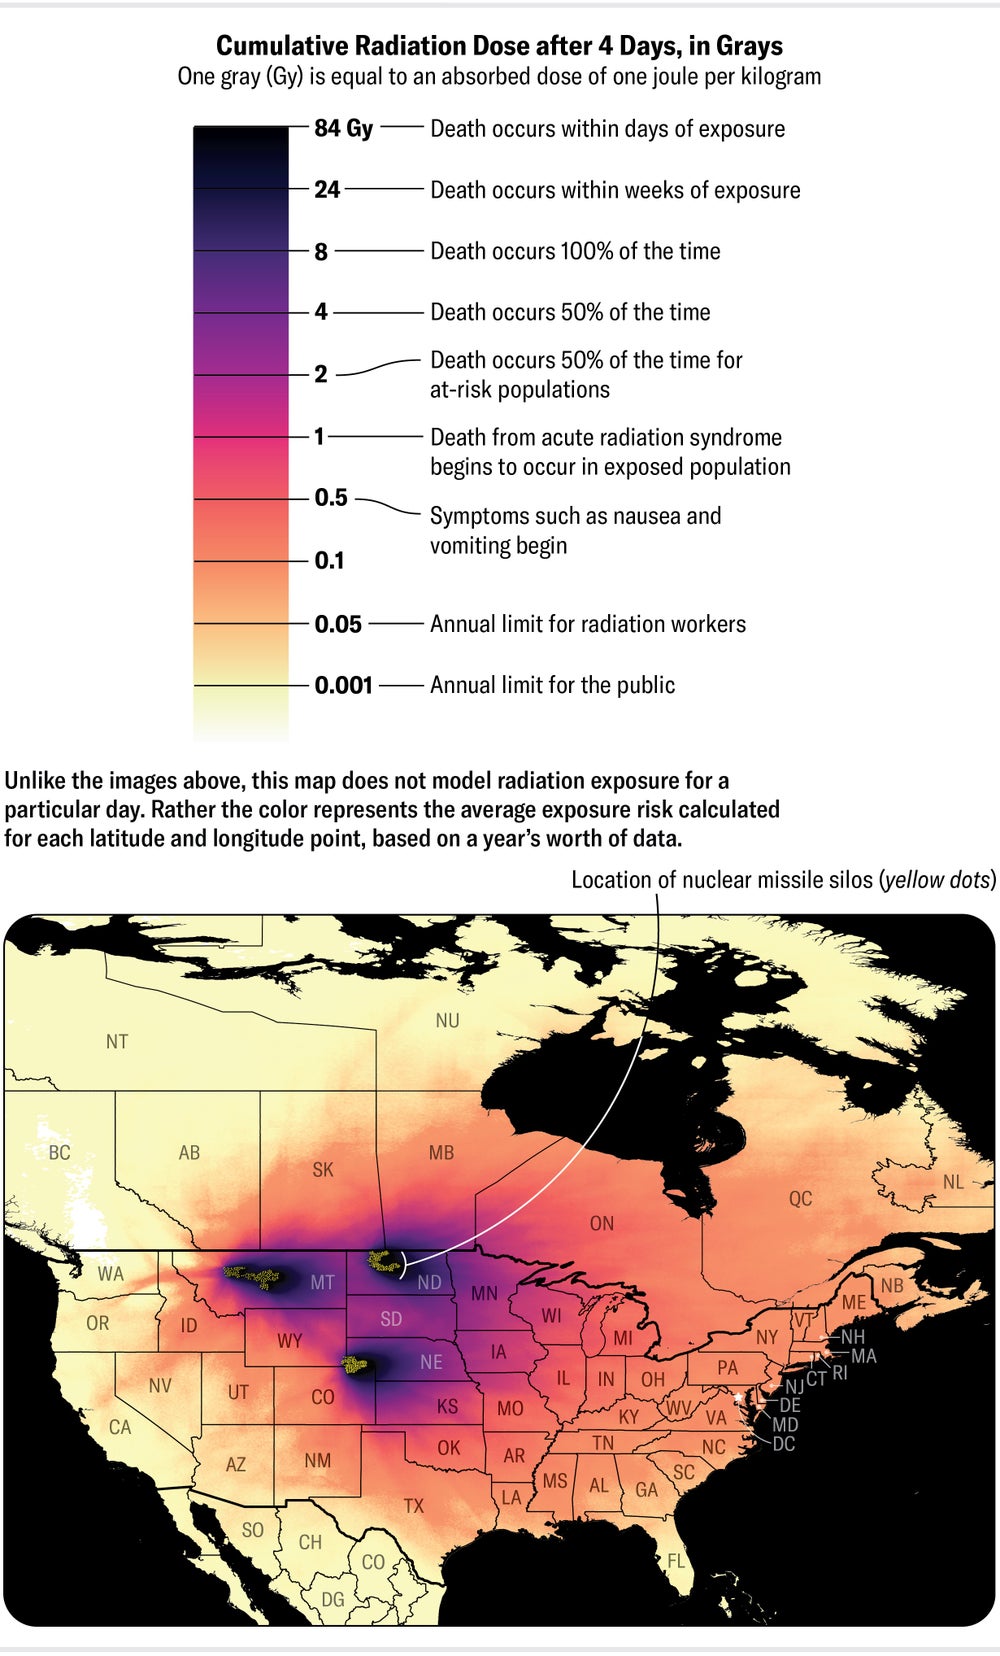
To calculate the average risk of radiation exposure at any given location in North America from a nuclear attack on the silo fields, Philippe and his co-workers summed the simulated outcomes for any day of 2021 (preceding graphic) and divided by 365. They thereby averaged the impact of shifting winds on radioactive fallout across the continent. This map shows the average outdoor radiation dose across North America after four days of exposure. Communities living closest to the silos could receive several times more than 8 Gy, which scientists regard as lethal. Most inhabitants of Montana, North Dakota, South Dakota, Nebraska and Minnesota would get average doses greater than 1 Gy, causing fatalities from acute radiation syndrome, especially among children. The U.S. population would receive average doses greater than 0.001 Gy per year, which is the current annual limit for exposure to the public.

Credit: Sébastien Philippe, Svitlana Lavrenchuk and Ivan Stepanov
THE WORST-CASE SCENARIOS
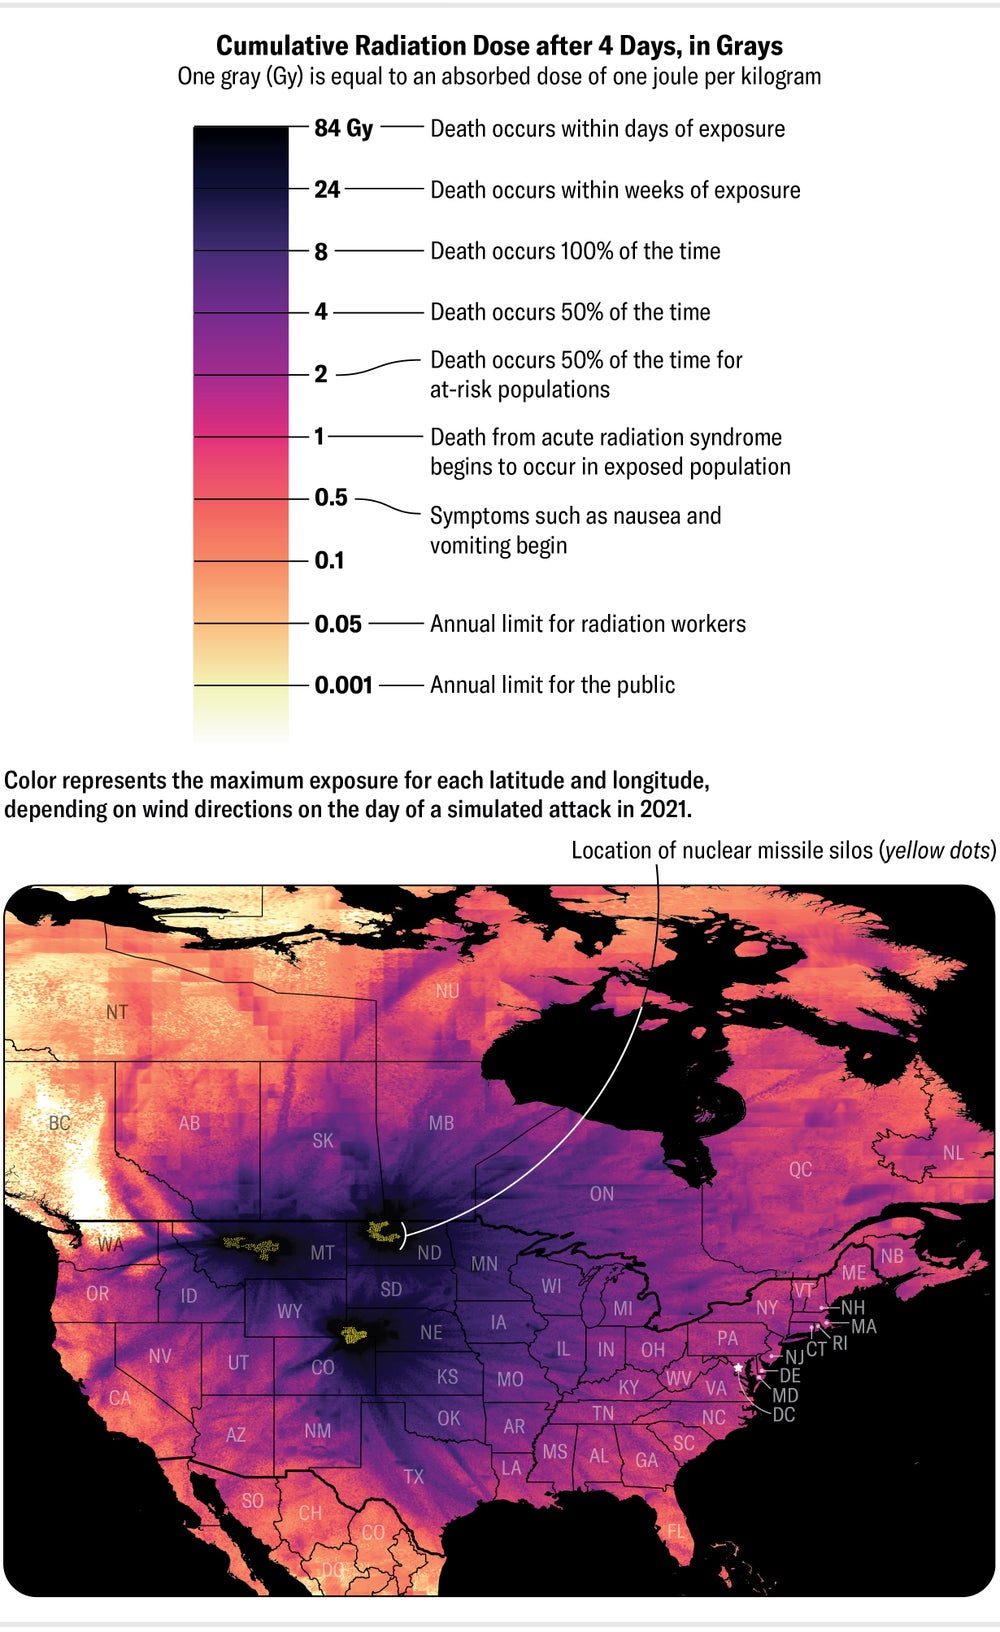
Sifting through simulations for each day of 2021, the Princeton researchers computed the worst possible outcome at each location from a concerted nuclear attack on the missile silos. This map shows all the worst-case scenarios across North America. Not all locations would experience the worst outcome from the same attack; which areas would be impacted depends on wind patterns on the day of the attack. Overall, most people in North America live in areas with about a 1 percent chance of receiving an outdoor dose greater than 1 Gy. The chance of getting a lethal dose escalates closer to the silos, with three million at risk of receiving 8 Gy or more. These simulations make no assumptions about access to health care or emergency services. Nor do they include other sources of exposure such as immediate radiation from nuclear explosions.

Credit: Sébastien Philippe, Svitlana Lavrenchuk and Ivan Stepanov
is a scientist at Princeton University's Program on Science and Global Security. He develops methods for monitoring nuclear weapons and models the impact of nuclear explosions.
You are using an out of date browser. It may not display this or other websites correctly.
You should upgrade or use an alternative browser.
You should upgrade or use an alternative browser.
Miscellaneous News
- Thread starter bd popeye
- Start date
If you want to know how pathetic this country is, this is what passes for plausible deniability in Canada
I don’t think anyone with enough grams of brain cells to perform any critical thinking skills believed that “random” Canadians would be arrested. There’s thousands of Canadians in China, they just randomly arrest the guy with links to the Soros regime change organization (International Crisis Group) and another guy that hangs out with Kim Jong Un for kicks?
Pretty obvious what’s happening now. Guy wanted more money to keep quiet but the government said no.
Politician fulfilling election promise? Madness!The Peninsula
President Mohamed Muizzu of the Maldives formally requested on Saturday that India withdraw its troops from his archipelago, fulfilling his election pledge on his first day in office.
Well, it seems that US embassy call was a success
Taiwan elections: KMT-TPP joint presidential ticket talks break down over technicality
- The TPP’s Ko Wen-je says he can’t agree to the KMT’s calculation to decide who will be the top contender
- The KMT says the difference is small and the discussions are not dead
Taiwan’s two main opposition parties have failed to agree on a joint ticket in January’s presidential election, with less than a week to go until the deadline for registering candidates.
The main opposition Kuomintang (KMT) and the smaller Taiwan People’s Party (TPP) have until Friday to come up with a joint ticket and their failure to do so in talks on Saturday was a blow to those hoping they will team up to challenge the ruling, independence-leaning Democratic Progressive Party (DPP) in January.
The KMT and the TPP agreed three days ago to announce on Saturday who would be their presidential candidate and their running mate.
But the two sides baulked at how to interpret an aggregate of opinion polls they previously agreed to use to decide who would top the ticket.
I am still struggling to understand the purpose of Xi's visit to US. As it turns out, US secured concessions from China (resumption of military communications and fentanyl deal) without giving anything in return. To add to the humiliation, Biden called Xi a "dictator" and now U.S. Defense Secretary announced that US will continue to violate China's sovereignty and territorial integrity. I must call it like I see it. APEC summit was an L for China. I hope that Chinese leadership knows what it's doing when it comes to US and that there is an explanation for their timid approach as of late.
Marcos doing a little bit of trolling here.
In any case, he might want to cool things down because with US engaged in 2 fronts, if China smacks Philippines head, all Marcos would get by its Lord US would be some thoughts and prayers
In any case, he might want to cool things down because with US engaged in 2 fronts, if China smacks Philippines head, all Marcos would get by its Lord US would be some thoughts and prayers
South China Sea disputes should not define ties, Philippine leader Marcos tells China’s Xi at Apec
- Ferdinand Marcos Jnr requested Friday’s meeting with Xi Jinping on Apec sidelines to discuss South China Sea issue, Philippine president’s office says
- Run-ins in resource-rich waters have largely marred relations between rival claimants Beijing and Manila, prompting US to renew defence pledge
President Ferdinand Marcos Jnr of the Philippines said he told Chinese leader Xi Jinping that disputes over the South China Sea should not define bilateral ties.
“But nonetheless, the problems remain and it is something that we will need to continue to communicate to find ways to avoid such incidents,” Marcos told reporters following a meeting with Xi on the sidelines of the Apec summit in San Francisco.
The two leaders met on Friday to seek ways to defuse tensions over territorial rights in the busy waterway, where Philippine and Chinese vessels, including coastguard ships, have clashed in recent months.
A
azn_cyniq
Guest
It seems that Americans and Europeans are waking up from a decades-long slumber
This is not good for the Chinese diaspora. The same people that despise Jewish people despise us even more. In my opinion, the attempts by the Jewish elite to control the media has led to an unstoppable rise in antisemitism in recent years. I would not be surprised if another Holocaust-scale event happens within my lifetime. People around me of all ethnicities are openly antisemitic now and I am currently attending a prestigious university with a strong Jewish presence in a blue state. It's probably much worse in other parts of the US. I think many Jewish people may not be aware of the recent rise in antisemitism because they only interact with other Jewish people, but it's real.
Chinese people should be prepared because the same people will no longer pretend to just "hate the CCP."
superstition, cult, religion, their difference is only in how many people follow it.
Sometimes I wonder if the Jews are just strike Willy Nilly because they have the weapons to do so and not for any real purpose except to cause human suffering and get away with it by quoting the Torah. Feels more like a cult rather than a nation at times.
I am still struggling to understand the purpose of Xi's visit to US. As it turns out, US secured concessions from China (resumption of military communications and fentanyl deal) without giving anything in return. To add to the humiliation, Biden called Xi a "dictator" and now U.S. Defense Secretary announced that US will continue to violate China's sovereignty and territorial integrity. I must call it like I see it. APEC summit was an L for China. I hope that Chinese leadership knows what it's doing when it comes to US and that there is an explanation for their timid approach as of late.
This was China deliberately giving up more so that they can reduce the tension and avoid further US sanctions, trade wars, tech war, investment war escalation. China is the one trying to rise up, US has already risen and is in a stronger position. So, for China to achieve fast growth, they need to keep their head down and avoid losing access to the west. This maybe humialiting but its the most beneficial and fastest way for China to achieve economic growth.
But most likely the west will still continue to escalate and continue decoupling, sanctioning and so on. But if China can slow that down just a little bit, if they can buy time for even 5-10 years, that will still give China more wealth and prosperity and better able to withstand the decoupling in the future.
The west is desperate to stop China and will do anything to stop it, even if it harms their own advantages and economy. They are on a war of attrition mode against China. So, China is playing defensive warfare.
