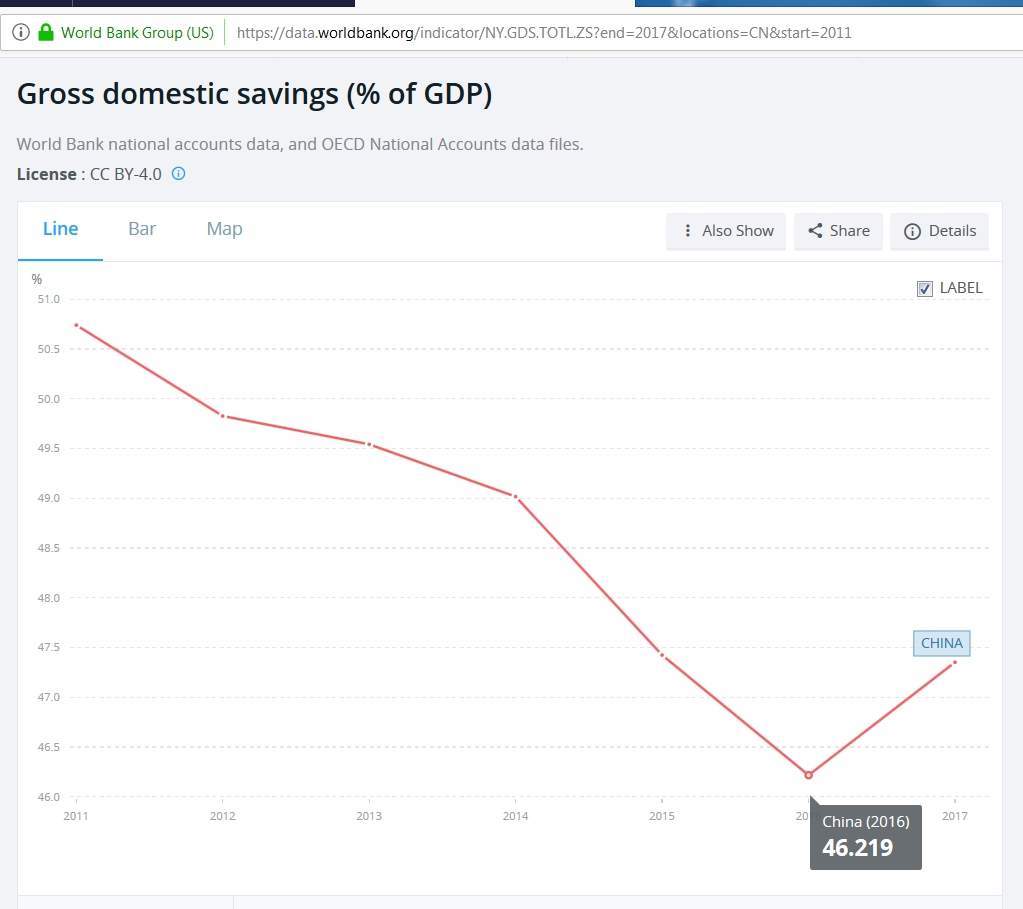
You haven't calculated the net change in disposable income.
The last, saving rate, you calculated the full value, not the CHANGE FROM YEAR TO YEAR.
Year 0 -> +100 income, -20 saving, +10 new debt =90 spending
Year 1 -> +95 income , -15 saving , +15 new debt =95 spending
Inverse :
Year 0 - >+90 spending,, -20 saving, +10 new debt=100 income
Year 1 -> +95 spending, -15 saving , +15 new debt =95 income
Another interesting data, the interest on bank saving is less than half % in China, the loans must be over 4%.
Now, it means that if the bank deposits are 80% of GDP, and debt is around 50% then the consumers spending 5 times more money for debt servicing than they receive from deposits.
And additionally the most wealthy has high saving rate, the middle / low income taking debt.

