Just to point out that the 0.41sqm average RCS of J-20 is significantly larger than what J-20 was required to be which is less than 0.3sqm.btw, someone did a lot work in RCS analysis of j-20. Keep in mind these figures are posted without considering the RAM layer. He clearly stated how he did the simulation, so you can make your own judgement of these things
Here is the end result of J-20 in his simulation

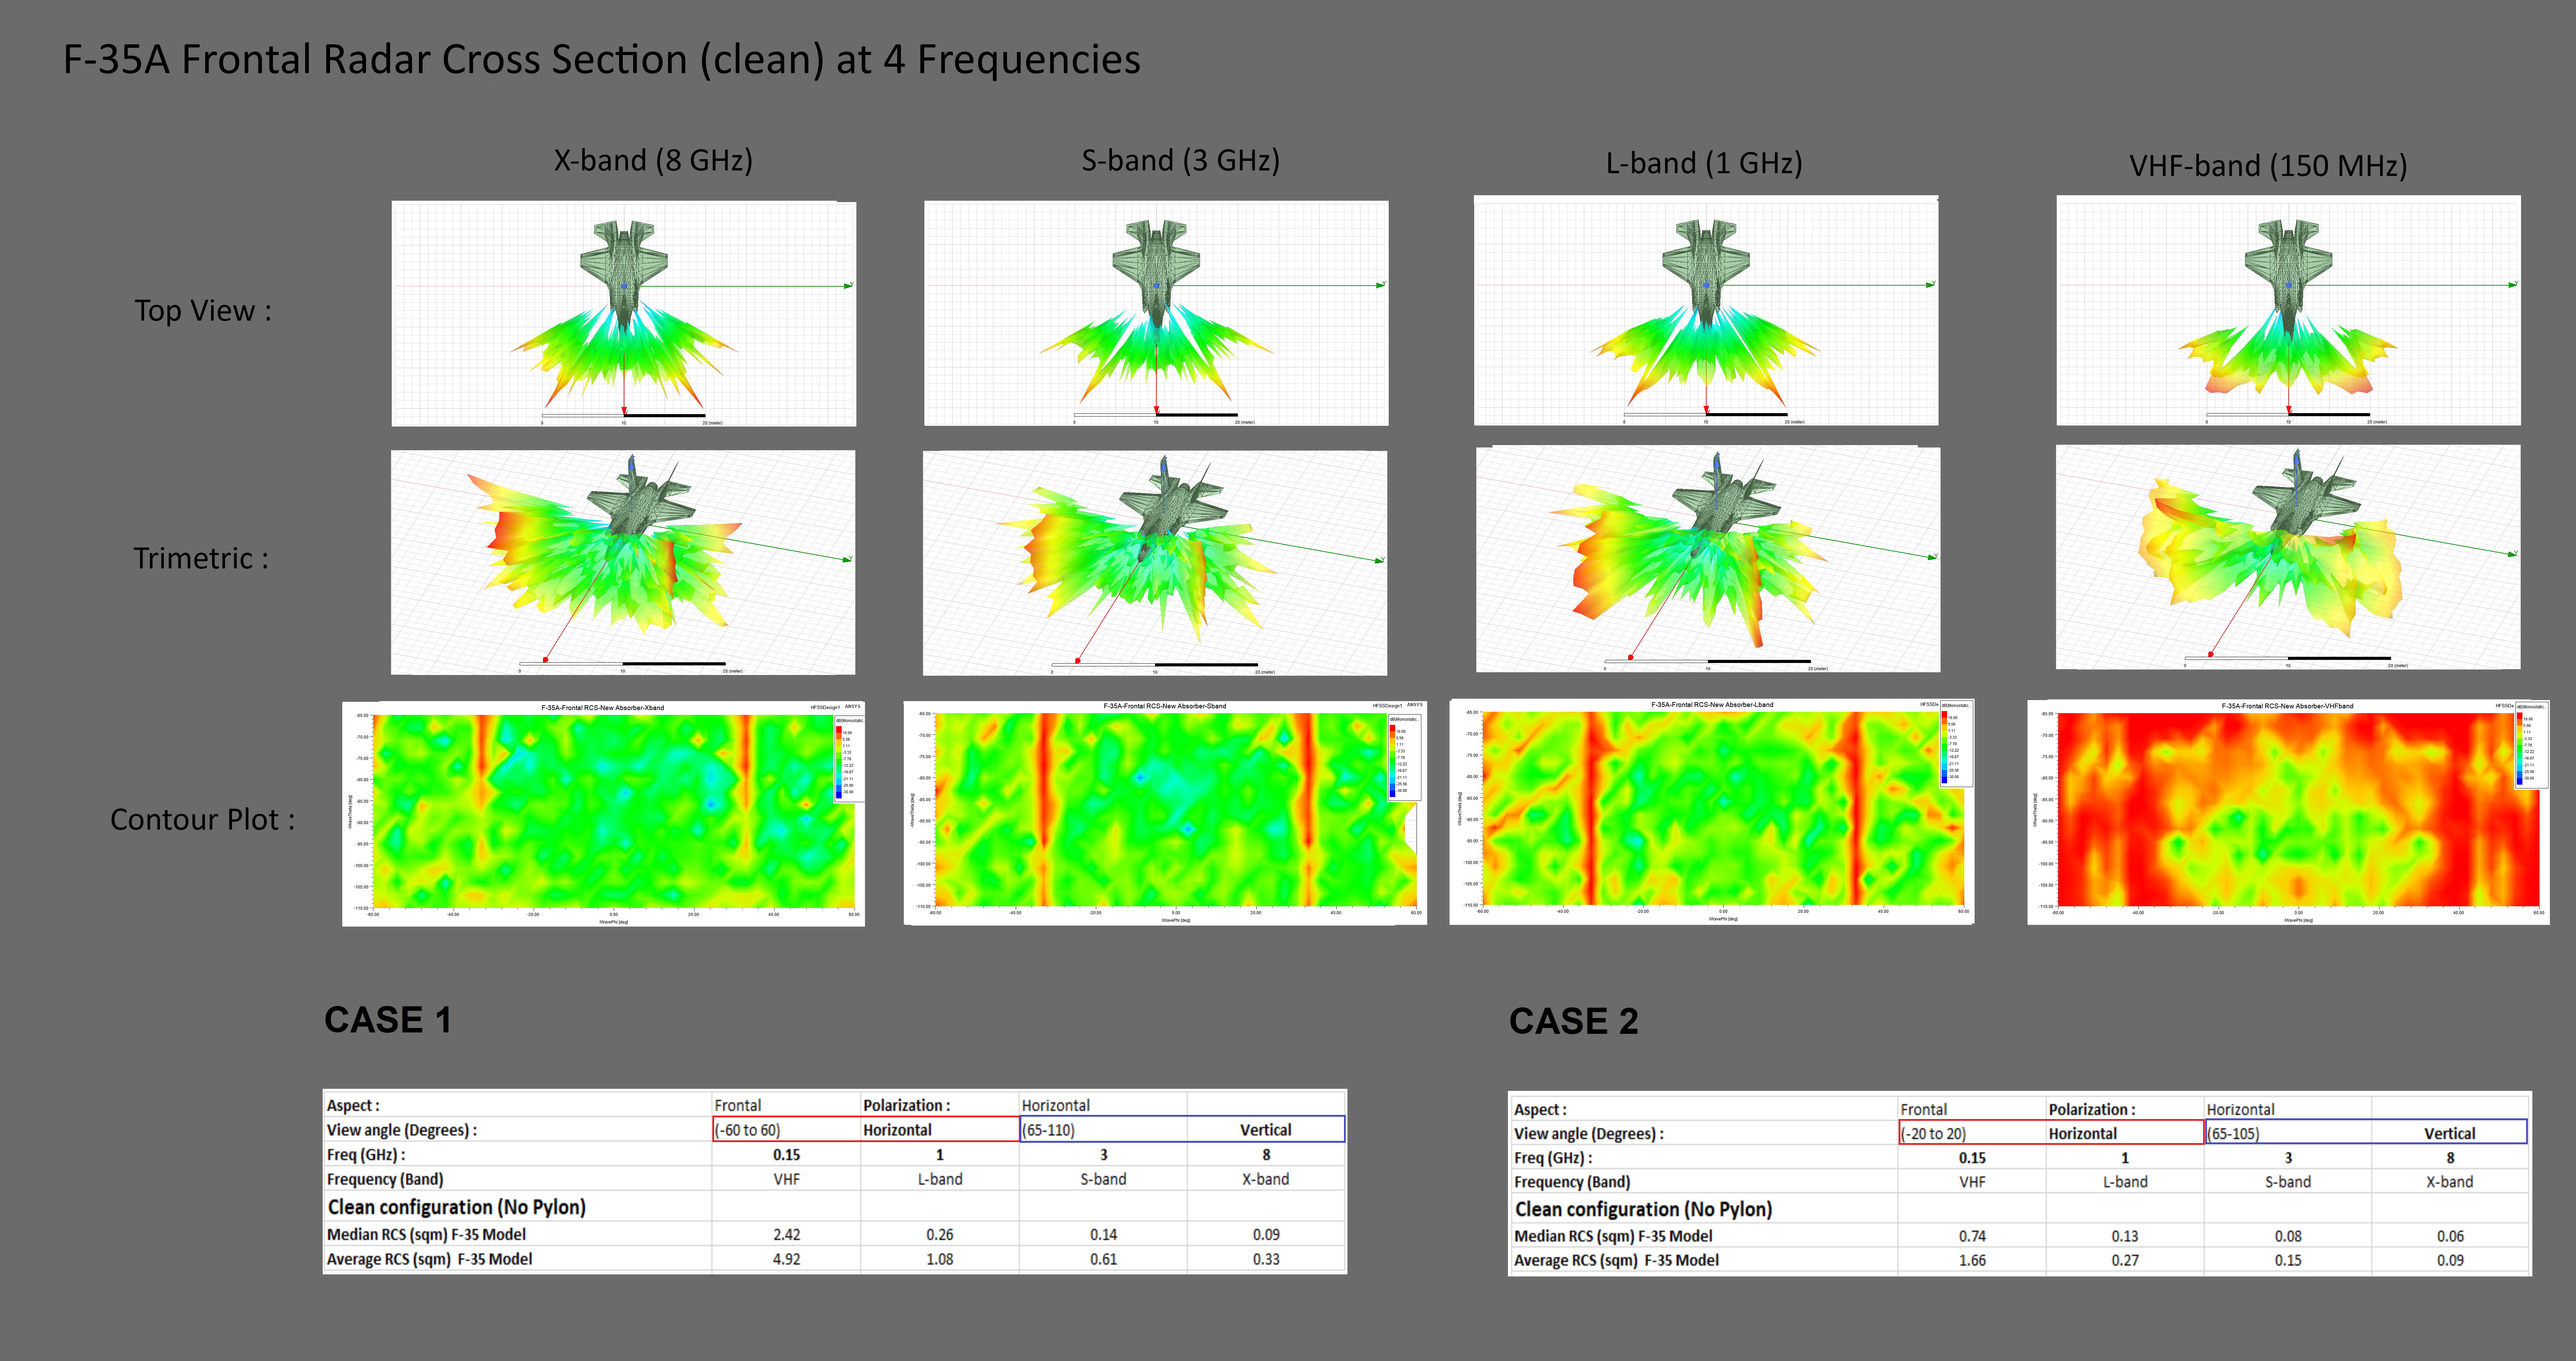
vs F-35

Based on his analysis, you'd see that average RCS of J-20 faired the worst vs F-35A at X-band. From VHF to L band, the numbers look quite comparable. It seems like F-35A is also very much focused on just S to X band radar directly in front of its nose. Its stealth gets a lot worse as frequency decreases and angles are further away from the center.
Besides, I am puzzled by lots of people doing this kind of simulation without accurate 3D model of J-20. In radar reflection, every 1 degree matters, every centimeter matters. These people either have direct access to such model from CAC, or just bullshitting.
Why I doubt? Everybody who has been to engineering university must have the experience to match their experiment results in the lab to the expected results from their professors. Some times, +-5% is acceptable, other times +-1% is wrong, without knowing if the input is reliable, the output is just rubbish even one get a number close.
My very latest experience, I found a bug in our product that has been there for years because nobody has tested a specific range of numbers. It looks perfect omitting that range, but results weird behaviour when the range is used as input. This kind of seemingly weird behaviour is the most difficult bug to be discovered. My motto is questioning everything, nothing is to be assumed right until all known corners have been swiped, even after that error should still be expected because one does not know if one know.
Last edited:
