Chinese Economics Thread

manqiangrexue

Brigadier
Household debt to GDP is NOT a single data pont.

It showing brutal indebtness of the chinese households, .

Now the question is the saturation point, and by the available data it is 2017.

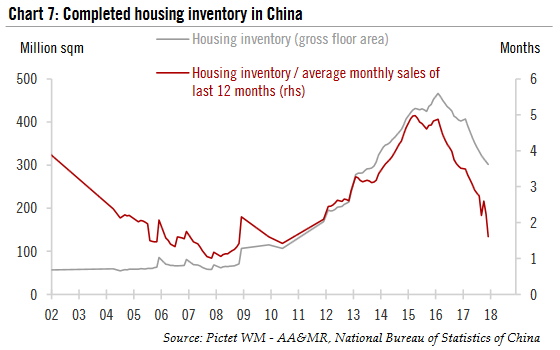
The interesting data point should be the housing starts / sales/ prices, but there I haven't found any data, appart from this:
Screenshot-26_1_2018-%D0%B3-007.png
You are so stupid that you don't even know what data you are looking at when you post it. That's not a sales or price chart; that's an inventory chart. The red line is labelled inventory/sales, and its drop means that there is little housing available compared to demand, you idiot. It says the exact opposite of what you want it to say. Here's an article to explain why this is and why it's a welcome phenomenon:
Please, Log in or Register to view URLs content!
. One more for good measure:
Please, Log in or Register to view URLs content!


You are literally a person who can't even read a chart who thinks he can analyze global/Chinese economics.

If you think the "inflection" is 2017 with confidence, then answer the question that's been asked of you so many times: What is your overall economic prediction for Chinese GDP for 2018? There needs to be a hard point where you can tell people that your predictions were right or wrong; if not, you're just spewing meaningless oral diarrhea indefinitely.
 
Last edited:

antiterror13

Brigadier
The population density fo China is more similar to the UK than the Australia / US.
At the moment the car stock of China is around 200 million, and the production is around 25-30, so in 8 years time they will have 400 million car, 320/1000 person.
Not far away from the UK.

To reach the UK level the production has to increase by 50% ,means 2-5 years to reach that level with 10% growth.

ten years to reach the saturation point, after that the GDP/ consumption ratio has to be like in the UK.

See?

The growth is nt balanced, if you follow simple scenarios neither of them add up.


China area is roughly 40x of the UK and China's population is roughly 20x of the UK ... so actually China's population density is 1/2 of the UK ... much less if you compare between China and England

I don't see why China's car density need to reach the UK's level .. don't need to. China's public transport is very good and in fact most people in the city don't have a car because too expensive and they don't need to have a car
 

Anlsvrthng

Captain
Registered Member
You are so stupid that you don't even know what data you are looking at when you post it. That's not a sales or price chart; that's an inventory chart. The red line is labelled inventory/sales, and its drop means that there is little housing available compared to demand, you idiot. It says the exact opposite of what you want it to say. Here's an article to explain why this is and why it's a welcome phenomenon:
Please, Log in or Register to view URLs content!
. One more for good measure:
Please, Log in or Register to view URLs content!
I know what is this chart, this is the closest one to the transaction volume.

The prices chart is meaningless, the transaction volume is the interesting.

The interesting should be the monthly colume : )


Anyway, if the inventory drop then the finished construction lower than the sales volume.

Now the question is if the sales volume increased, or the production volume decreased.

Data points from your link ( thanks : ) )
sales: +5.3% november ,-6% october, YoY
finished construction : ? , but based on inventory data it should be in negative territory
new cosntruction start : +18.8%

Overal investmetn level ( ? ) 4.6% / 5.6%

the data doesn't add up as well.
if the overal invesmtent level is means all part of the housing construction pipeline, then it should increase to the 18.8% level.
 

Anlsvrthng

Captain
Registered Member
China area is roughly 40x of the UK and China's population is roughly 20x of the UK ... so actually China's population density is 1/2 of the UK ... much less if you compare between China and England

I don't see why China's car density need to reach the UK's level .. don't need to. China's public transport is very good and in fact most people in the city don't have a car because too expensive and they don't need to have a car
Big part of China is mountain , and have 0 population density.
If you consider Enland population density then it is way higher than the UK data, because Scotland ( and Walles) is empty.

The remaining part has extreme level o population density.


If the public transport is good in china, and if needs lover level of car ownership than UK then the current level of car sales is the ballance point, and the car sales won't add to the GDP any more, and the road construction as well wasted money from this point.
 

manqiangrexue

Brigadier
I know what is this chart, this is the closest one to the transaction volume.

The prices chart is meaningless, the transaction volume is the interesting.

The interesting should be the monthly colume : )


Anyway, if the inventory drop then the finished construction lower than the sales volume.

Now the question is if the sales volume increased, or the production volume decreased.

Data points from your link ( thanks : ) )
sales: +5.3% november ,-6% october, YoY
finished construction : ? , but based on inventory data it should be in negative territory
new cosntruction start : +18.8%

Overal investmetn level ( ? ) 4.6% / 5.6%

the data doesn't add up as well.
if the overal invesmtent level is means all part of the housing construction pipeline, then it should increase to the 18.8% level.
You know this chart? LOL You don't know shit.

There is no such thing as "closest to transaction volume." It either is transaction volume, or it's not, and here, it's NOT.

Those numbers don't add up because you're not supposed to add them up; they're either data from different times or different statistics. Why should investment and construction be the same at the same time? You expect 18.8% investment to cause 18.8% construction both in the same month? LOL Why are you so stupid and talking so much? Construction is the result of investments from multiple months beforehand. And also, construction by floor space does not need to be linear to investment at all; investing the same amount in a 1 story house in Texas as a luxury apartment in Manhattan is not going to give you proportional data. There is no reason that those numbers are supposed to "add up."

In case your reading comprehension is as bad as your chart-reading, the first article I posted from Financial times says that the drop of available housing compared to demand is the accumulation of potential energy for China's economy; once construction takes off, housing purchases should follow closely, transforming into a burst of kinetic energy to give another boost to GDP growth.

How many times do you have to be proven wrong before you shut up? It's not going to get less embarrassing for you as you try to BS good data into bad data, you know.
If the public transport is good in china, and if needs lover level of car ownership than UK then the current level of car sales is the ballance point, and the car sales won't add to the GDP any more, and the road construction as well wasted money from this point.
I think you have wasted money confused with wasted words of your nonsense with this crap again. In general, you have China confused with the UK. China: big country, vast territory, growing sales and expanding GDP. UK: small country, everything stagnant. Getting these confused does not make you look smart.

Why do you keep hiding from this?
"If you think the "inflection" is 2017 with confidence, then answer the question that's been asked of you so many times: What is your overall economic prediction for Chinese GDP for 2018? There needs to be a hard point where you can tell people that your predictions were right or wrong; if not, you're just spewing meaningless oral diarrhea indefinitely."
 
Last edited:

Anlsvrthng

Captain
Registered Member
Why do you keep hiding from this?
"If you think the "inflection" is 2017 with confidence, then answer the question that's been asked of you so many times: What is your overall economic prediction for Chinese GDP for 2018? There needs to be a hard point where you can tell people that your predictions were right or wrong; if not, you're just spewing meaningless oral diarrhea indefinitely."
The chinese GDP in 2018 will be the number that the Chinese goverment targeting for 2018.

It is that simple : )


If they need to make new 8 lane highways in Tibet to connect the goat farms to reach this number then they will do that : D

The household consumption number is maybe a bit more interesting, and showing better indicator.
 

manqiangrexue

Brigadier
Only posting important parts because article doesn't let you copy the whole thing for anti-piracy purposes. Basically, China's economy is in for another boost as housing construction is expected to be able to pick-up to meet demand after a successful "de-stocking." That means good things for various upstream Chinese sectors like cement, steel construction, etc...

Please, Log in or Register to view URLs content!

China housing inventory hits 4-year low on de-stocking success
New data undercut warnings of looming housing bubble

The volume of unsold Chinese homes hit a four-year low last month, in a sign that new construction can cushion an expected economic slowdown next year, while persistent
Please, Log in or Register to view URLs content!
may be overstated.

De-stocking of housing inventory was a key element in President Xi Jinping’s “
Please, Log in or Register to view URLs content!
” campaign to address excesses in a range of industries.

A
Please, Log in or Register to view URLs content!
has powered overall Chinese growth this year, putting the economy on pace for its first year-on-year
Please, Log in or Register to view URLs content!
.

But growth of both sales and new construction has slowed for most of the year, with analysts expecting the slowdown to continue into 2018. The government has imposed a series of
Please, Log in or Register to view URLs content!
to restrain price growth, amid concerns over both financial risk and affordability for lower-income residents.

China housing inventories are at a 4-year low.

Still, the latest data suggest that developers will need to maintain a relatively quick pace of construction to keep up with demand, despite the sales slowdown. New construction will in turn drive demand for the output of China’s huge manufacturing sector, including steel, cement and glass.

The data “thoroughly illustrate that the country’s three-year battle to digest inventories has achieved very good results”, Yan Yuejin, research director for E-House, wrote in the report.
 

manqiangrexue

Brigadier
The chinese GDP in 2018 will be the number that the Chinese goverment targeting for 2018.

It is that simple : )


If they need to make new 8 lane highways in Tibet to connect the goat farms to reach this number then they will do that : D

The household consumption number is maybe a bit more interesting, and showing better indicator.
Oh, hey! Well, congratulations on your first semi-intelligent post! It shows me that you're just here to talk trash to comfort yourself, but deep down, we both have faith in the Chinese economy. That is very simple. Good use of the term, first time you got it right! We agree, so why are you wasting everyone's time, then? To talk about a 6-7% annual growth "crisis"? LOL If the Chinese economy growing at the government's target every year is your definition of a crisis, then we are in FULL CRISIS MODE LOL

Ho ho, goat farmers need 8-lane highways too if they're gonna turn into businessmen and their goat farms into metropolises! (We still need goat farms though, not ragging any hard-working farmers but high tech upgraded are welcome.)

Well, household consumption is rising too, along with GDP, but it's only a part of the the overall GDP and growth so saying that it's more of an indicator than the GDP is like saying that the muscles on one of your arms is a better indicator of health than an overall health check.
 

manqiangrexue

Brigadier
Please, Log in or Register to view URLs content!

Why China’s consumers will continue to surprise the world
By Jeffrey Towson and
Please, Log in or Register to view URLs content!


Why China’s consumers will continue to surprise the world

Fears about China’s slowing economy are overblown, authors Jeffrey Towson and Jonathan Woetzel argue in this adapted excerpt from the follow-up to their The One Hour China Book.

China has an awesome consumer story. Yet lately you can’t pick up a newspaper, go online, or watch television without hearing continual moaning about the country’s slowing economic growth and the need for “rebalancing.” The reality is that Chinese consumers are going to continue to increase in wealth and complexity. And if you’re worried the country’s economic importance is declining, you’re probably looking at its performance the wrong way.

Don’t worry about consumer spending as a percentage of GDP
As in most developing Asian economies, China’s early growth was based on savings, investment, and exports. You get your population to save, move to the cities, work in factories, and make stuff. This is sold, and cash is brought back home for investment. Plus, you get some foreign investment as well. This process enabled China to develop its infrastructure largely with its own cash. That, by the way, is not the norm. Developing economies typically borrow from foreigners and then default—for example, American states such as Mississippi and Florida were chronic defaulters on foreign debt as they initially developed.

One of the downsides of this investment-first approach is that it makes consumption look small and often like it’s shrinking. Chinese consumption decreased from approximately 51 percent of gross domestic product in 1985 to 43 percent in 1995, 38 percent in 2005, and 34 percent in 2013. By comparison, consumption is around 61 percent in Japan and about 68 percent in the United States. In fact, China’s small and decreasing consumption percentage is one reason why people keep talking about “rebalancing”—the need for the economy to become driven more by consumer spending than investment and exports.

Our position? Don’t worry about this stuff.

First, from 2000 to 2010, the size of the Chinese economy more than doubled.
Please, Log in or Register to view URLs content!
So consumption grew from around $650 billion to almost $1.4 trillion. Regardless of its relative percentage of GDP, China’s consumption has been growing faster than just about any other country’s in absolute terms. Second, just getting consumer spending back to 43 percent of GDP, the level in 1995, would have a huge impact on “rebalancing.” It would also create the largest consumer market in the world. Third, most of these numbers are wildly inaccurate. Consumer spending is nearly impossible to measure in such a big, complicated economy. Combining a vague number with two other big vague numbers (investment and net exports) is very fuzzy math. Until economists start putting uncertainty estimates on their China calculations, relative percentages aren’t worth paying much attention to.

Household income is what matters, and it’s great
The number you really want to keep in mind is household income. You can’t have consumption without income. And here’s where it gets really awesome. China’s household income is huge. It is now likely above $5 trillion a year. Plus, lots of income is unreported, so this is really the lower boundary for true household income. Developing economies—especially the BRIC nations of Brazil, Russia, India, and China—are frequently grouped together, but Chinese consumers dwarf all the others in terms of household income (Exhibit 1).

Exhibit 1
China’s total household income dwarfs other emerging markets.
SVGZ_OneHourChina_ex1_REVISED.ashx

Rising discretionary spending is the exciting part
Discretionary spending is buying the stuff you like but don’t need. Or you only sort of need. And, fortunately, people seem to have an endless appetite for everything from entertainment to skiing to caffe lattes. Chinese citizens are now moving beyond being able to only afford the basics of life, and their discretionary spending is taking off. Growth in spending on annual discretionary categories in China is forecast to exceed 7 percent between 2010 and 2020, and growth of 6 to 7 percent annually is expected in a second category of “seminecessities.” Both of these categories are growing faster than spending on actual necessities, which are expected to grow around 5 percent a year, about the same as expected GDP growth (Exhibit 2).

Exhibit 2
Discretionary categories are showing the fastest growth.
SVGZ_OneHourChina_ex2.ashx

Finally, an important related issue is the Chinese tradition of saving. If we compare spending and saving rates across the emerging markets, we see a spike in savings in China. That spike is fairly understandable. First, it’s cultural. Second, they are precautionary savings—no social safety net means if you get sick, it’s all on you. Third, Chinese savings are not unique. Japan, Korea, and Taiwan all hit 30-percent-plus savings rates in their early development. And fourth, without much of a consumer-finance system, it’s tough to use debt to hit truly spectacular consumption levels. After all, a vacation home or car may cost the equivalent of a year’s income.
 
Top