
You are using an out of date browser. It may not display this or other websites correctly.
You should upgrade or use an alternative browser.
You should upgrade or use an alternative browser.
Chinese Economics Thread
- Thread starter Norfolk
- Start date

I'm getting a 4.3% in most western sources, not 4,7.
Chinese GDP only grew 4.7 percent for the first half of this year. Consumer demand seems to collapse as soon as government incentives end.
Q2 (4.3%) alone vs. H1 (4.7%):I'm getting a 4.3% in most western sources, not 4,7.
初步核算,上半年国内生产总值695704亿元,按不变价格计算,同比增长4.7%。
分产业看,第一产业增加值31522亿元,同比增长3.7%;第二产业增加值250473亿元,增长3.9%;第三产业增加值413709亿元,增长5.2%。
分季度看,一季度国内生产总值同比增长5.0%,二季度增长4.3%。从环比看,二季度国内生产总值增长0.9%。
Not surprising. It's expected that consumer demand cools after dissolution of incentives. Surprising that's it grew at all. But factory activity continues to be strong
Chinese GDP only grew 4.7 percent for the first half of this year. Consumer demand seems to collapse as soon as government incentives end.
4.3 is YOY, 4.7 is YTD.I'm getting a 4.3% in most western sources, not 4,7.
Not surprising. It's expected that consumer demand cools after dissolution of incentives. Surprising that's it grew at all. But factory activity continues to be strong
They should pump up the economy by using more incentives for buying more cars.

I doubt It'll work long term which is something they'd actually need, as with basically everything they've tried so far as soon as it's gone, demand instantly collapses.They should pump up the economy by using more incentives for buying more cars.
The only way to increase demand is to set a price floor for housing, guarantee a price floor for houses. Buy empty houses and change it to social housing. Provide support so housing prices plateau and even slowly turned upward.I doubt It'll work long term which is something they'd actually need, as with basically everything they've tried so far as soon as it's gone, demand instantly collapses.
Increase social safety nets. Increase medical coverage. Perhaps make children medical care completely free. Decrease burden on house holds.
Adjust the pension system. Either increase the retirement age to 65 or use pension to buy into the stock market massively, get others to buy into the stock market as a wealth generator. Use state funds to buy the stock market as well.
Then will you see demand increase.

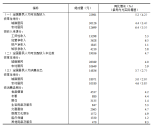
In the first half of 2026, per capita disposable income in China increased 5.2% year-on-year. Income of rural residents increased faster than that of urban residents (6.4% vs 4.4%).
By income source, income from wages, transfers, and business operations grew by 5.3%, 5.8%, and 6.5% respectively while income from assets/property increased only 1.1%.
- Per capita income from wages increased 5.3% YoY, accounting for 57.9% of disposable income
- Per capita income from transfers increased 5.8%, accounting for 18.3% of disposable income
- Per capita income from business operations increased 6.5%, accounting for 15.8% of disposable income
- Per capita income from assets/property increased 1.1%, accounting for 8.0% of disposable income
In the first half of 2026, per capita disposable income in China increased 5.2% year-on-year. Income of rural residents increased faster than that of urban residents (6.4% vs 4.4%).
By income source, income from wages, transfers, and business operations grew by 5.3%, 5.8%, and 6.5% respectively while income from assets/property increased only 1.1%.
- Per capita income from wages increased 5.3% YoY, accounting for 57.9% of disposable income
- Per capita income from transfers increased 5.8%, accounting for 18.3% of disposable income
- Per capita income from business operations increased 6.5%, accounting for 15.8% of disposable income
- Per capita income from assets/property increased 1.1%, accounting for 8.0% of disposable income
This data release adds nuance to the standard narrative that Chinese consumption is weak.
It's true that 2026 1H nominal consumption (3.7%) grew slower than wage growth (5.3%) or even GDP growth, but the composition matters.
The two biggest drags are healthcare (1.2%) and housing (+1.4%). These are mostly non-discretionary and not what most people mean by "consumer spending."
The slow growth of these two categories is perhaps by design and desired given recent policies like volume-based procurement (集采), dramatically cutting drug and device costs and "housing is for living not speculation" policies reducing house prices.
Meanwhile, the discretionary-looking categories look healthier, especially "Other goods & services" (9.3%) which includes personal care, haircuts, skincare, gym fees, and parts of tourism.
US-China comparison is even more distorted. The numbers are heavily skewed by health care spending and imputed rent calculations. America has more healthcare workers than China despite 1/4th the population (14% of US workforce vs 2-3% in China). That all counts as "consumption," but more healthcare spending does not automatically mean better consumer welfare.